

The dashboard
The dashboard is the page JungleMail 365 opens on, and the one the JungleMail logo in the top menu leads back to. It brings together your site’s latest results, what is being sent right now, and what is coming up. Everything on it follows the site you have chosen in the top menu. Use it for a quick look each morning and to plan the weeks ahead; for the results of a newsletter, open its report.
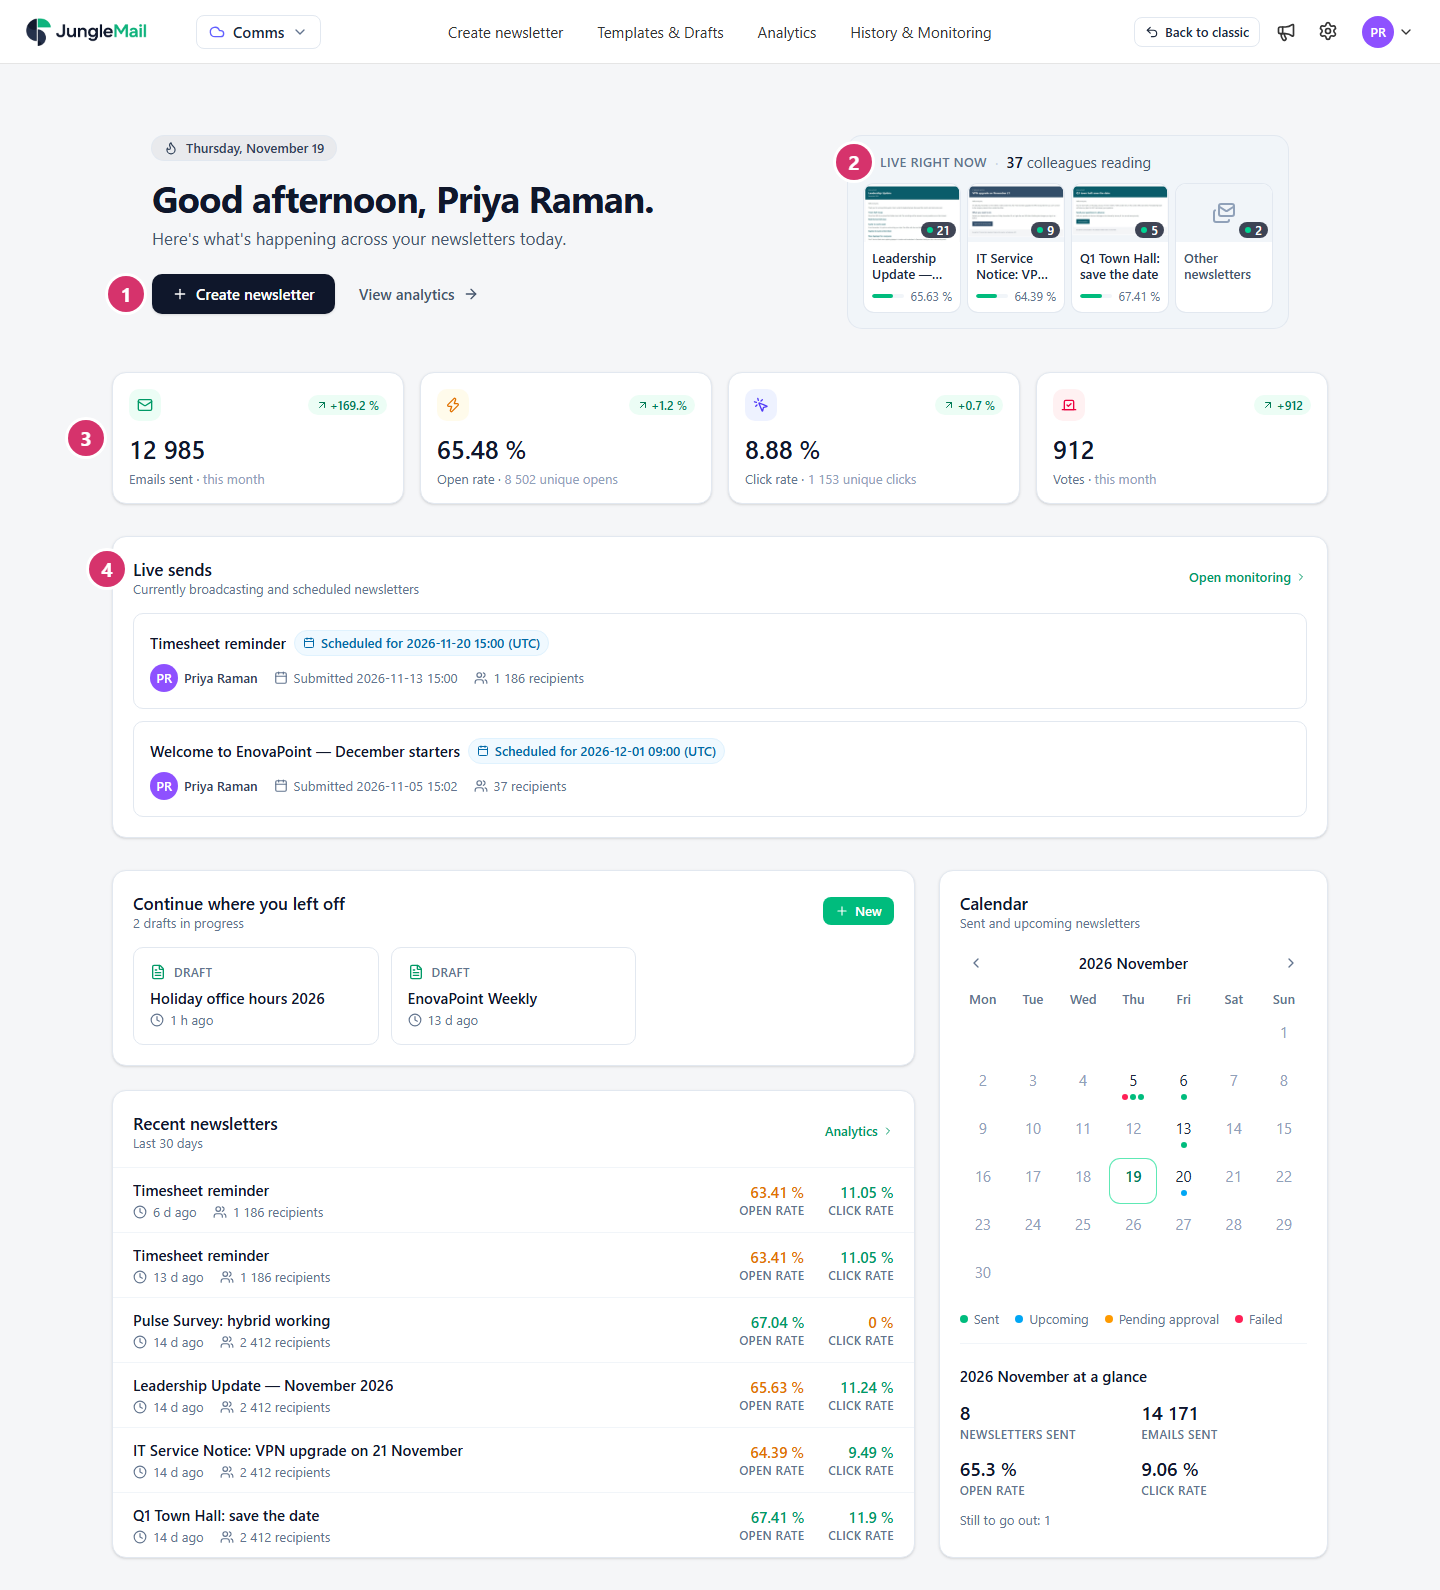
- Create newsletter starts a new newsletter, and View analytics opens the Analytics page.
- Live right now counts the recipients reading your newsletters at the moment: those who opened, clicked or answered a survey in the last 10 minutes. The newsletters with the most readers have a tile each, with the number of readers and the open rate; select a tile to open that newsletter’s report. Other newsletters counts the readers of the rest. The card updates by itself.
- This month’s figures so far: Emails sent, Open rate, Click rate and Votes. The badge on each tile compares it with the same days of last month; point to it to see that figure. Select the open or the click tile to switch both between rates and unique counts.
- Live sends lists the newsletters being sent or waiting for their scheduled time, with their progress. Open monitoring goes to History & Monitoring.
Further down
Section titled “Further down”- Continue where you left off shows your latest drafts. Select one to continue it, New to start a newsletter, or See all drafts for the rest.
- Recent newsletters lists the six latest newsletters sent in the last 30 days, with their recipients, open rate and click rate. A rate is green when it is at or above the rate of all the newsletters sent in those 30 days, and red when it is below. Analytics opens a newsletter’s report.
- Calendar shows a month of newsletters: those sent, those still to go out or waiting for approval, and those that failed or were skipped. Under it, at a glance sums up the month: newsletters sent, emails sent, open and click rates, and how many are still to go out. Move between months with Previous month and Next month.
The results on the dashboard come from the same tracking as the reports (How open and click tracking works). If your role doesn’t include viewing newsletters, the dashboard shows only its greeting.
- Read this month’s badges with care early in the month. They compare with the same days of last month, so one large newsletter sent on the 3rd last month and on the 10th this month swings them for a week. For a fair comparison, use Analytics or Trends (Compare periods with Trends).
- Check the Calendar before you schedule. It shows the site’s newsletters sent, planned and waiting for approval, so that a new one doesn’t land on the same morning as another (Send or schedule a newsletter).
- Open the report of a red rate in Recent newsletters. A red rate means the newsletter did less well than the site’s last 30 days: its click map and its subject tell you why (Read a newsletter report).
- Watch Live right now after a send. Readers appearing there within the first minutes tell you the newsletter is arriving; if the card stays empty while Live sends shows progress, check that Track email opens was on: without it, the card shows only readers who click a link or vote (Delivery, tracking and report options).