

Read a newsletter report
Every newsletter you send gets its own report in JungleMail 365. It opens on the Summary tab, which holds the main figures; the other tabs look at links, groups of recipients, locations and surveys. Read it to learn what to change in your next newsletter: its subject, its send time or where its links sit.
Open a report
Section titled “Open a report”- Select Analytics in the top menu.
- Select the newsletter’s name in the list. To find it, see Find and compare newsletter results.
You can also open a report from History & Monitoring: select More actions (⋯) beside the newsletter, then Open analytics. In a report opened from the list, Previous and Next at the top open the reports of the newsletters before and after it there.
Read the Summary tab
Section titled “Read the Summary tab”The report opens on the Summary tab.
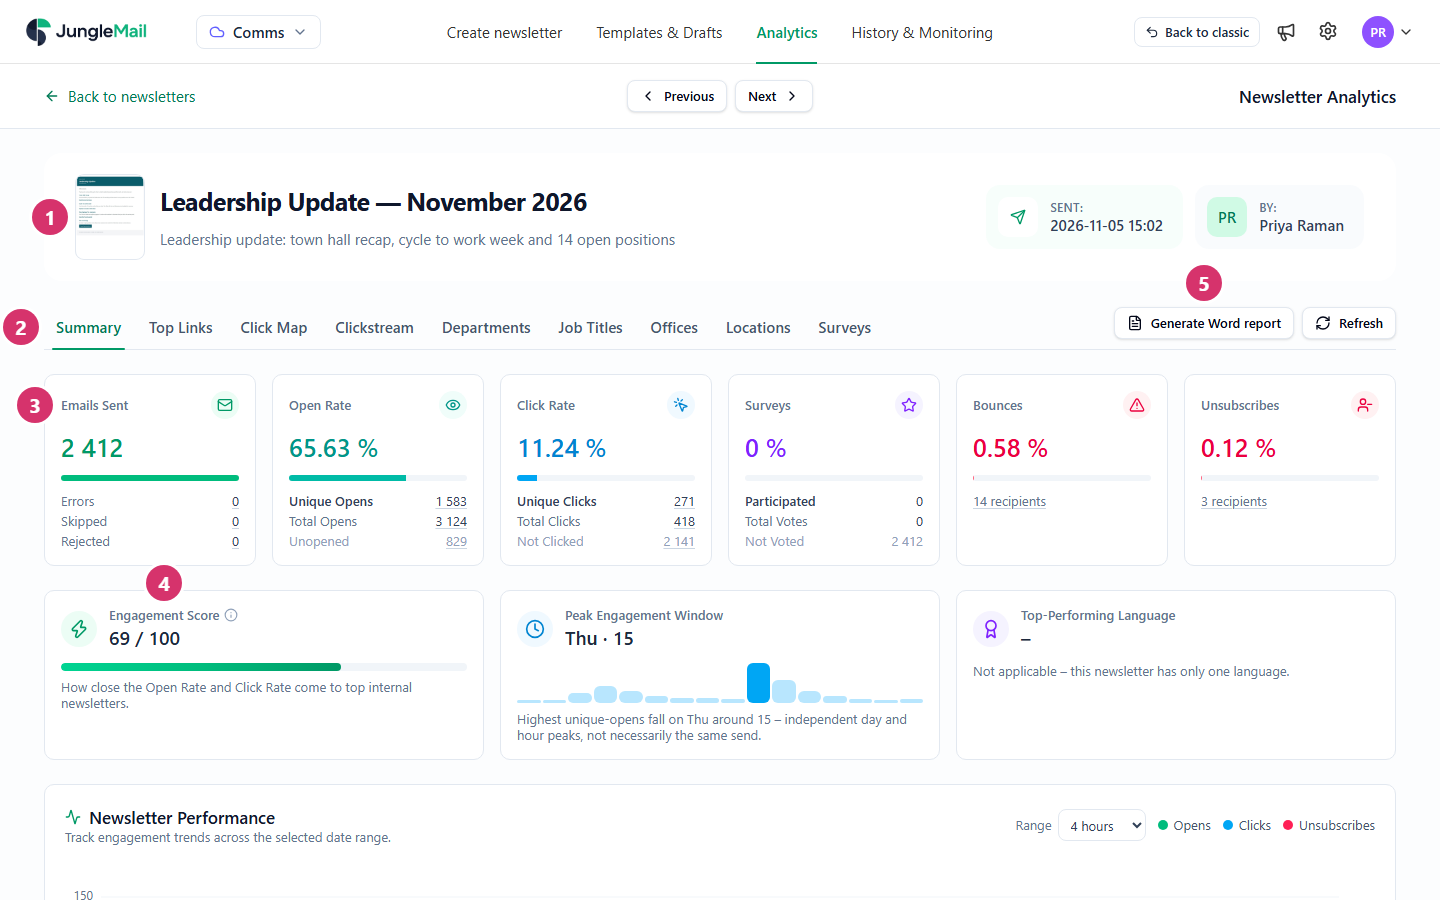
- Check which newsletter you are looking at: its name, its subject, when it was sent and who sent it. Select the name, or the picture of the newsletter beside it, to open the newsletter’s preview, with its content, recipients and settings.
- Use the tabs to look closer at the newsletter. Which tabs appear depends on your site’s analytics settings.
- Read the main figures in the tiles; the table below says what each one counts. Select a count, such as the number of Unique Opens, to see who it is (See who opened or clicked).
- Read the highlights:
- Engagement Score compares the open and click rates with those of top internal newsletters, an open rate of 80% and a click rate of 20%. Each rate scores 100 at that level and proportionally less below it, and the score is the average of the two. Point to the information icon beside it to see the calculation. Use it to compare your own newsletters with each other, and look at the two rates behind it to see which one moved.
- Peak Engagement Window is the day of the week and the hour of the day with the most unique opens. Many people read a newsletter as it arrives, so the window reflects the hour it was sent as well as readers’ habits; it tells you more when you compare newsletters sent at different times.
- Top-Performing Language compares the open rates of a newsletter sent in several languages.
- To keep or share the report, select Generate Word report (Export results to CSV or Word). Refresh loads the latest figures.
| Tile | Shows |
|---|---|
| Emails Sent | Emails sent. Errors could not be sent, Skipped were not sent, and Rejected were left out because the address is on the rejections list |
| Open Rate | The share of emails opened. Unique Opens counts each recipient once, Total Opens every open, Unopened the rest |
| Click Rate | The share of emails in which a link was clicked, with Unique Clicks, Total Clicks and Not Clicked |
| Surveys | The share of emails with a survey answer: Participated, Total Votes and Not Voted |
| Bounces | The share of emails that bounced, and how many recipients that is |
| Unsubscribes | The share of emails that led to an unsubscribe, and how many recipients that is |
How opens and clicks are counted is explained in How open and click tracking works.
Below the figures
Section titled “Below the figures”- Newsletter Performance charts unique opens, unique clicks and unsubscribes over time. Choose the period in Range, from the first 4 hours to 90 days.
- User Behavior shows Reading Devices, the share of opens on a desktop, a phone or a tablet, and when people opened the newsletter: Opens by Day of Week and Opens by Hour of Day.
The other tabs
Section titled “The other tabs”| Tab | Shows |
|---|---|
| Top Links, Click Map, Clickstream | Which links were clicked, where they are in the email, and in what order (Links, click map and clickstream) |
| Departments, Job Titles, Offices, Companies | The results per group of recipients (Results by department, job title, office and company) |
| Locations | The results per country (Results by location) |
| Surveys | The answers to the newsletter’s surveys (Survey results) |
When there are more tabs than fit, the rest are under More tabs (⋯) at the end of the row.
Newsletters in several languages
Section titled “Newsletters in several languages”A newsletter sent in several languages has a language switch above the tiles: ALL, then one button per language. Choose a language to see its figures. The performance chart, the day and hour charts and the lists of recipients are available for ALL only.
- Judge a newsletter once its opens level off. The Newsletter Performance chart shows opens still arriving after the first hours, so this morning’s newsletter looks weaker than last month’s until its line flattens.
- Read the click rate with the open rate. Normal opens with few clicks point to the content: the Click Map shows whether the main link sat too low (Links, click map and clickstream). Low opens point to the subject and preview text, which are all that recipients see before they decide (Write the subject and preview text).
- Move the send time on the evidence of several newsletters. Send a few issues at different times, compare their Opens by Hour of Day, and schedule the next ones for the time that keeps coming out ahead (Send or schedule a newsletter).
- Design for the devices people read on. When a third of opens are on phones, as for EnovaPoint’s Leadership Update, check every newsletter on a phone before you send it (Preview and test a newsletter).