

Compare periods with Trends
The Trends tab of Analytics in JungleMail 365 puts two periods side by side: two years, two quarters, or a quarter and a year. It covers every newsletter your site sent in each period, so it shows whether your newsletters are reaching people better than before. Use it for a quarterly or yearly review; to compare single newsletters, use the list on Newsletter Analytics (Find and compare newsletter results).
Compare two periods
Section titled “Compare two periods”Select Analytics in the top menu, then the Trends tab. It opens on last year and this year, or, for a site that started this year, on the last quarter and this one.
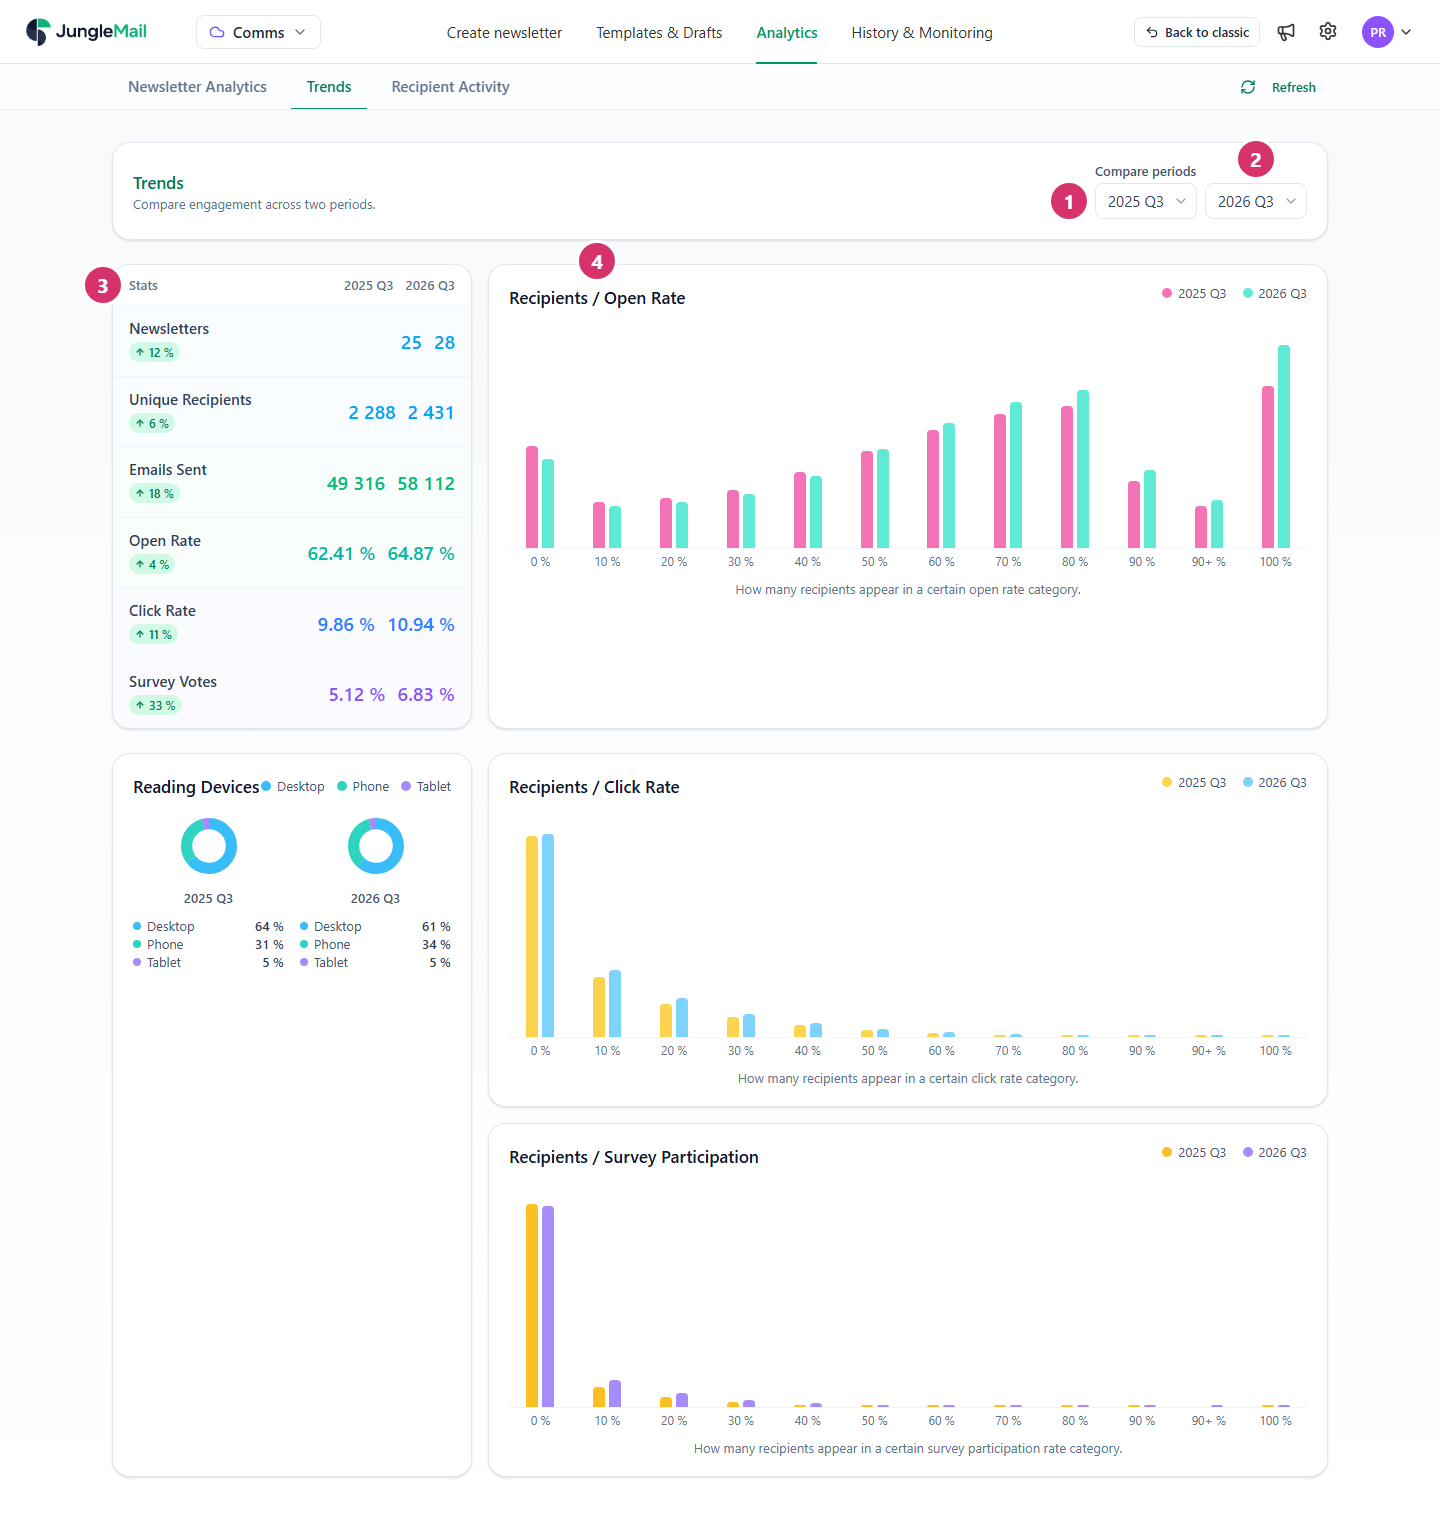
- In Compare periods, choose the first period, such as a quarter of last year. Choose a finished period where you can: its figures no longer change.
- Choose the period to compare it with, such as the same quarter this year, so that seasons don’t skew the result.
- Read Stats: for each period, Newsletters, Unique Recipients, Emails Sent, Open Rate, Click Rate and Survey Votes. The badge under each name is the change from the first period to the second, as a share of the first: an open rate going from 62.41% to 64.87% is a change of 4%. Green is a rise, red a fall.
- Read the charts. Recipients / Open Rate sorts the recipients by their own open rate in each period: the bar at 0 % counts those who opened none of the newsletters they received, the bar at 100 % those who opened every one. More recipients toward the right means more people reading regularly. Recipients / Click Rate and Recipients / Survey Participation do the same for clicks and survey answers, and Reading Devices shows the share of opens on desktops, phones and tablets in each period.
Comparing the same quarter of two years leaves out seasonal differences, such as fewer newsletters over the summer. A period that hasn’t ended yet, such as this year, has fewer newsletters than a finished one, and its figures still change.
Notes above the figures
Section titled “Notes above the figures”For …, … of … newsletters have pseudonymized recipient data – related numbers may be incomplete. Newsletters sent with anonymous tracking count their opens and clicks but not who they were, so Unique Recipients and the charts leave those recipients out (How open and click tracking works).
Trends covers the site you have chosen in the top menu. The Global site has no Trends tab (Results across all sites). It follows Hide test newsletters: with the switch on, newsletters marked as tests are left out of both periods (Find and compare newsletter results).
- Look at how readers spread, not only at the average. An open rate can hold steady while more people read every newsletter and more read none. Recipients / Open Rate shows which. A growing bar at 100 % is a group of regular readers; a growing bar at 0 % is people you may be losing, though it also holds those who read with pictures blocked, so check Recipients / Click Rate before you conclude.
- Check what changed in the counting before you credit the newsletters. If your IT team made Outlook load the images during the period, more opens could be counted; if anonymous tracking was turned on, Unique Recipients and the charts lose those newsletters’ readers (How open and click tracking works).
- Find the newsletters behind a change. When Open Rate falls, set Sent date on Newsletter Analytics to the same period and look for the red arrows: one weak newsletter can pull a quarter down (Find and compare newsletter results).
- Weigh more newsletters against the rates. When Newsletters rises and Open Rate falls, read the Recipients / Open Rate chart too: the same people may be receiving more than they read. Combining smaller notices into a regular newsletter such as EnovaPoint Weekly is one way to send less.